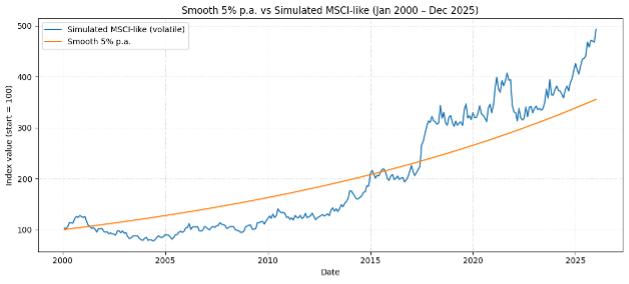
Early career (20s–30s)
Blue line — Volatile growth
Time is your greatest asset. Short-term crashes matter little when retirement is 30 years away. Riding out the dips and compounding the recoveries is exactly what long time horizons are designed for.
Mid-career accumulation (40s)
Blue line — Volatile growth
You still have a long runway. Regular contributions during market dips mean you are buying cheaply. Volatility, paradoxically, works in your favour when you are still saving rather than drawing down.
Approaching retirement (50s–early 60s)
Orange line — Smooth growth
The risk calculus shifts sharply. A severe market fall five years before you retire can permanently impair your income in retirement. Sequence-of-returns risk is real — and the orange line protects against it.
Retirement & drawdown (65+)
Orange line — Smooth growth
When you are drawing an income from your portfolio, you are selling units. Selling in a crash locks in losses permanently. Smoothed, predictable growth lets you plan withdrawals with confidence.
The case for blending both
For many clients, the right answer is not one line or the other — it is both. A classic approach is to hold the orange-line strategy for near-term income needs (the next 3–5 years of retirement spending, for example) while maintaining a blue-line allocation for longer-term capital that has time to recover from any drawdown.
This is sometimes called a “bucket” or “liability-matching” approach. It provides the psychological security of the smooth line for money you will need soon, while preserving the growth engine of equities for money with a longer horizon. The exact blend depends on your income requirements, your existing assets, your state pension, and — critically — your personal tolerance for seeing your wealth fall temporarily on a statement.
“Volatility is not risk in itself. Risk is being forced to sell at the wrong moment. Proper planning ensures you never are.”
The distinction that changes everything
A word on behaviour-
There is one final factor the chart cannot show: human behaviour. The blue line’s superior long-run return is only realised by investors who stay invested through every crash. Research consistently shows that the average investor underperforms the average fund because they sell in panic and re-enter too late. If the volatility of the blue line would cause you to make emotional decisions — to cash out in March 2009, say, just before the extraordinary recovery — then the orange line would have made you richer, not poorer.
The right portfolio is not just the one with the best theoretical return. It is the one you will hold through the worst days. Understanding your own temperament is as important as understanding your time horizon.
Ready to map your own investment journey? Every client’s path is different. We’ll help you find the right blend of growth and stability — and build a plan you can stay with through every market cycle.