Tel: +34 93 665 8596 | info@spectrum-ifa.com | LinkedIn Facebook

Which investment journey is right for you?

By Chris Burke
This article is published on: 1st May 2026

Two roads to the same destination

One of the most important questions I ask when planning client’s investment/retirement strategies is: What investment journey do you want to go on? This is so important, as it will dictate their emotional tolerance to their investments over time.

which investment journey is right for you?

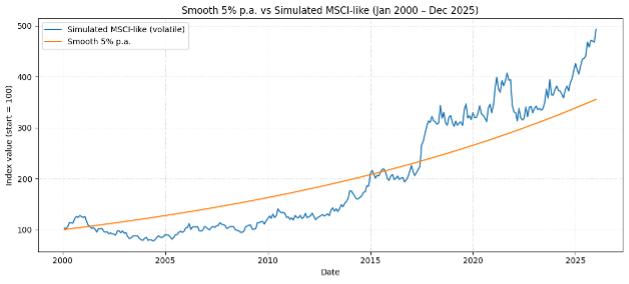
The chart above tells a remarkable story. Both paths start at 100 and end well above 350 — but the experience of getting there couldn’t be more different. Your life stage, not just your returns, should determine which road you take.

  • Simulated MSCI (global stock market benchmark-like, volatile) — blue line
  • Smooth 5% p.a. — orange line

Both lines begin at exactly the same place in January 2000 and travel across 25 years. The blue line — representing a globally diversified equity portfolio similar to the MSCI World Index — ends the period around 490. The orange line, a smooth 5% per annum return, ends near 350. On paper, the blue line wins handsomely.

But focus on the journey, not just the destination. The blue line plunges nearly 50% between 2000 and 2003. It crashes again in 2008–09. It lurches and jolts throughout, sometimes spending years below where the orange line sits. If your financial life depends on the value of that portfolio at a specific moment — to fund retirement, pay school fees, or cover care costs — that volatility is not an abstraction. It is a real and serious risk.

“The best investment is the one you can live with — through the crashes, the recoveries, and everything in between.”

A principle that shapes every recommendation we make

What the orange line actually represents

The smooth 5% line is not a fantasy. It is representative of a broad class of investments — smoothed funds, multi-asset income strategies, certain structured products, and with-profits vehicles — designed to deliver steady, predictable growth by dampening day-to-day market noise. The trade-off is explicit: you sacrifice the ceiling in exchange for raising the floor. You will rarely see a 40% gain in a year. You will also rarely see a 40% loss.

Over the full 25-year window in the chart, the volatile blue path generates significantly more wealth — roughly 40% more in absolute terms. But that outperformance is overwhelmingly concentrated in the later years, when the blue line breaks free of the orange and accelerates. An investor who needed to access their money in 2003, 2009, or 2012 would have fared far worse on the blue path than the orange.

+490 Blue line final value (start = 100)
+350 Orange line final value (start = 100)
2003 & 2009 — years the blue line fell far below the orange

Matching your journey to your life stage

Good financial planning is understanding what is right for your client, by probing and asking pertinent questions. This in essence is the heart of good financial planning: not chasing the highest number, but choosing the path that fits where your clients are and want to be in life. Here is how I think about it – although many people now want to retire early (Financial Independence Retire Early) so this can be adjusted.

Early career (20s–30s)

Blue line — Volatile growth
Time is your greatest asset. Short-term crashes matter little when retirement is 30 years away. Riding out the dips and compounding the recoveries is exactly what long time horizons are designed for.

Mid-career accumulation (40s)

Blue line — Volatile growth
You still have a long runway. Regular contributions during market dips mean you are buying cheaply. Volatility, paradoxically, works in your favour when you are still saving rather than drawing down.

Approaching retirement (50s–early 60s)

Orange line — Smooth growth
The risk calculus shifts sharply. A severe market fall five years before you retire can permanently impair your income in retirement. Sequence-of-returns risk is real — and the orange line protects against it.

Retirement & drawdown (65+)

Orange line — Smooth growth
When you are drawing an income from your portfolio, you are selling units. Selling in a crash locks in losses permanently. Smoothed, predictable growth lets you plan withdrawals with confidence.

The case for blending both

For many clients, the right answer is not one line or the other — it is both. A classic approach is to hold the orange-line strategy for near-term income needs (the next 3–5 years of retirement spending, for example) while maintaining a blue-line allocation for longer-term capital that has time to recover from any drawdown.

This is sometimes called a “bucket” or “liability-matching” approach. It provides the psychological security of the smooth line for money you will need soon, while preserving the growth engine of equities for money with a longer horizon. The exact blend depends on your income requirements, your existing assets, your state pension, and — critically — your personal tolerance for seeing your wealth fall temporarily on a statement.

“Volatility is not risk in itself. Risk is being forced to sell at the wrong moment. Proper planning ensures you never are.”

The distinction that changes everything

A word on behaviour-

There is one final factor the chart cannot show: human behaviour. The blue line’s superior long-run return is only realised by investors who stay invested through every crash. Research consistently shows that the average investor underperforms the average fund because they sell in panic and re-enter too late. If the volatility of the blue line would cause you to make emotional decisions — to cash out in March 2009, say, just before the extraordinary recovery — then the orange line would have made you richer, not poorer.

The right portfolio is not just the one with the best theoretical return. It is the one you will hold through the worst days. Understanding your own temperament is as important as understanding your time horizon.

Ready to map your own investment journey? Every client’s path is different. We’ll help you find the right blend of growth and stability — and build a plan you can stay with through every market cycle.

Book a conversation here.
You can also read independent reviews of my advice and service here.

This article is for informational purposes only and does not constitute personalised financial advice. Past performance is not a reliable indicator of future results. The chart shown uses simulated data for illustrative purposes.

Article by Chris Burke

If you are based in the Barcelona/Costa Brava area and would like to have an initial, complimentary face to face video call or arrange a time to visit Chris in his office in central Barcelona, contact Chris on chris.burke@spectrum-ifa.com or whatsapp +34 689915730.

Contact Chris Burke direct about: "Which investment journey is right for you?"

    The Spectrum IFA Group is committed to building long term client relationships. This form collects your name and contact details so we can contact you about this specific enquiry. For further information, please see our Privacy Policy.