Tel: +34 93 665 8596 | info@spectrum-ifa.com

Linkedin
Viewing posts categorised under: Investment diversification

Investment management styles

By Mark Quinn
This article is published on: 27th May 2022

27.05.22

There are several different investment management styles to consider and each will have benefits and drawbacks. The key difference are between a managed/active/discretionary route, and a passive/tracker approach, and this can be a divisive area within the investment industry.

In order to put into context the differences between these styles and which approach may be right for you, let’s first look at what a stock market index is.

An index simply measures the performance of a group/basket of shares. For example, the S&P 500 index tracks the performance of the shares in the largest 500 companies in America. As the US market is the largest stock market in the world, and the US is the world’s largest economy, it is often seen as a barometer for the health of global markets in general. The equivalent index in the UK is the FTSE 100 index.

investment styles

Managed/active management/discretionary
Historically, most private investors would invest through a fund manager. In this way, you would pay an annual percentage fee to an investment institution to actively manage your investment i.e. make the buying and selling decision on your behalf.

The aim of investing in managed investments is to generate better investment returns than the stock market index as a whole, or another appropriate benchmark.

Discretionary investment is a specialist branch of managed investment whereby the manager has a greater range of investment powers and freedoms to make buying and selling decisions without your consent (although always within with the remit and investment powers that you grant at outset).

Over recent years there have been numerous studies to suggest that many fund managers do not achieve their aims of beating their respective benchmarks, and it has led some investors to favour a “passive” investment approach.

Passive or index trackers

Passive investment does not employ a fund manger to make decisions, and instead of trying to outperform the market, you simply ‘buy’ the market as a whole. For example by investing in an S&P 500 tracker, you would effectively be purchasing the top 500 shares in the US stock market.

The key difference between the managed style is cost i.e. whereas a manager may charge between 1-2% per annum to manage your fund, you can access a tracker fund from as little as 0.1% which can make a huge difference to your fund value cumulatively.

Proponents of this approach accept they will only even achieve the return of the market as a whole (with no outperformance) but because you are spending far less in fees, believe they will do better over the longer term.

Proponents of active management on the other hand highlight the drawbacks of the passive approach viz. in a falling market, you will only ever track a falling market, tracker funds “blindly” sell what may otherwise be high quality investments at inopportune times, and that tracker investments can still be complex to understand, such as the difference between ‘synthetic’ versus ‘physical’ tracking methods.

Summary – balance pays
As my previous two articles have demonstrated, tax and investment planning generally involves shades of grey, rather than black and white solutions and in practice we do not believe either approach is the ‘holy grail’.

Rather each management style can offer benefits within a balanced portfolio. Holding passives can reduce the overall cost of your portfolio (thus increasing your net return) and using managed funds can complement by avoiding “blind” automatic sales and potential downside mitigation.

Whichever route you choose, minimising fund fees is crucial as it is the biggest eroder of returns over time.

Investment portfolios | The Principles of Success

By Mark Quinn
This article is published on: 18th May 2022

18.05.22

The world of investments can be intimidating, even for the most seasoned investor. Here, we will put aside the jargon and push past the hype of ‘the next big thing’, and instead focus on the key principles that every investor should know when building a portfolio of investments; irrespective of how engaged or involved you wish to be.

Ideally, you should look at your assets as a whole – your pensions, property, savings and investments, rather than at each area or structure in isolation. This way you can apply the principles to your wealth as a whole and be in the best position to potentially meet your financial objectives.

Asset allocation is key to investment success
Asset allocation is the percentage of each type of asset class making up your overall investment portfolio. In turn, asset classes are groupings of similar types of investments such as cash, equities, commodities, fixed income, or real estate.

The key principle behind asset allocation is to include asset classes that behave differently from each other in different market conditions to reduce risk and generate potential returns. For example, if equities are falling in value, certain fixed income assets may be rising.

The goal here is not solely to maximise returns but to blend your holdings to meet your goals, whilst taking the least amount of investment risk. The right allocation for you will depend on several factors such as your willingness and ability to accept losses, your investment time frame, and your future needs for capital – unfortunately, there is no one size fits all.

Many studies have shown that asset allocation is the most important driver of portfolio returns, so getting this first step right is critical.

Diversification to reduce risk
Once you have decided on the right asset allocation for you, you must then pick the individual types of holdings or investments within each asset class. Each asset class is broken down into subclasses, for example, fixed income includes holdings such as fixed deposits, gilts and government or corporate bonds.

It is not enough to simply own each type of asset class; you must also diversify within each asset subclass. For example, taking corporate bonds which is a type of fixed income asset class, you can hold them in many different types of companies, industries, currencies, countries, or long or short term.

Rebalancing
As assets perform differently over time, the initial percentage asset allocation will deviate over time. A typical example is the huge increase in the US stock market over the last couple of years which, whilst good for investors’ returns, will have increased the level of share exposure. This increase in the value of equity holdings because of the sustained rise will lead to increased risk across the portfolio as a whole.

This can be solved by regular rebalancing to ‘reset’ the portfolio to your original asset allocation. This involves selling holdings that are overweight and buying ones that are undervalued.

Rebalancing also provides the ideal opportunity to revisit your financial goals and risk tolerance, and to tweak your asset allocation accordingly.


investment portfolio

Long term perspective and discipline
As humans, our emotions can lead to poor decision making when it comes to investing. Decisions that seem logical in daily life can result in poor investment returns, with many retail investors selling through fear at the very point they should be buying at lower prices, and conversely, buying at much higher prices during a gold rush.

It is vital for most investors to keep a disciplined approach as it is easy to get caught up in the daily noise of the markets.

Minimise costs and maximise tax efficiency
Einstein described compounding as the 8th wonder of the world and the effect of compounding applies to fees. A charge that might seem small at the beginning can turn into a significant cost over time and research has shown that lower-cost funds tend to outperform in the longer term.

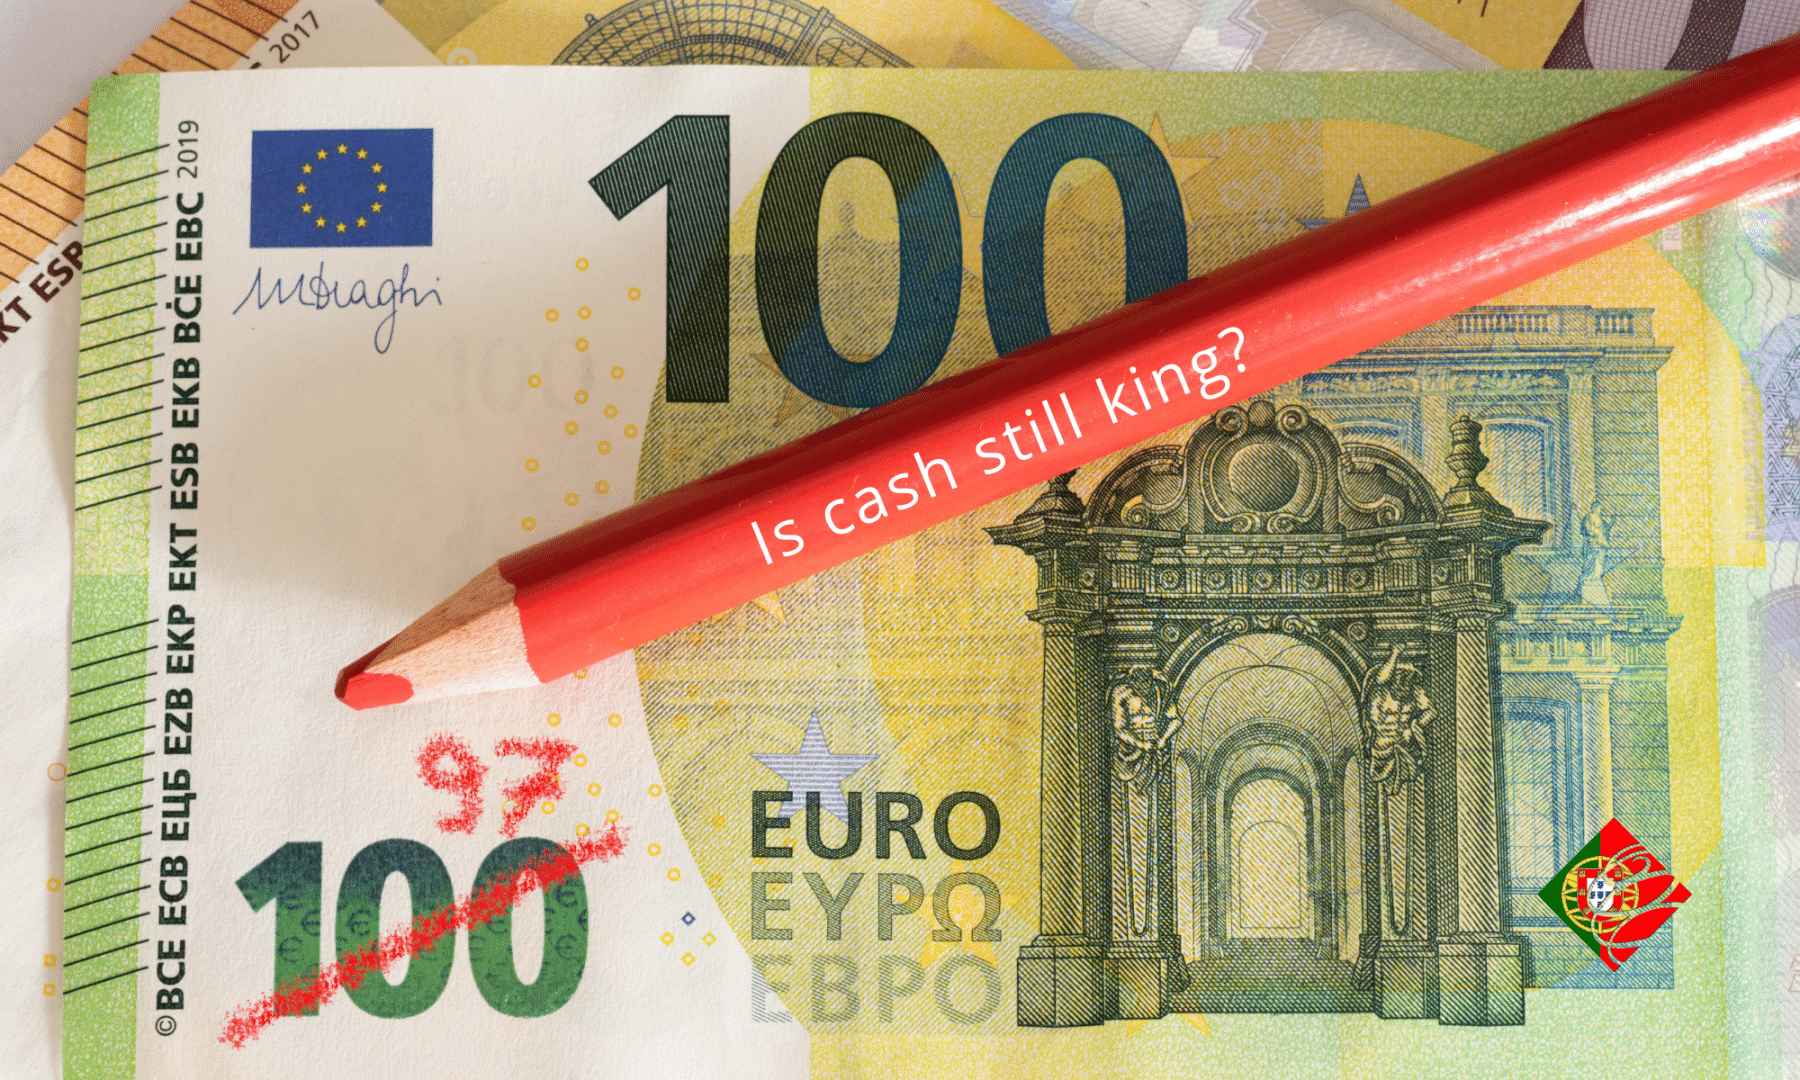
As a simple example, assume a €100 investment and no growth. After 10 years, an annual charge of 2% will result in €82, a 0.2% charge would result in €98.

Focus on minimising fund, structure and adviser fees. In the world of investing, more expensive does not necessarily mean better.

Tax is an often-overlooked cost, which if minimised can lead to the same positive compounding effects over time. This is done by ensuring that your investment portfolio is structured correctly for your resident status, and it might be different planning for normal residents, Non-Habitual Residents, or depending on if your move to Europe is for the rest of your life or if you intend to return to your home country in the future.

Withdrawal strategies
If you are taking income from your investments, you should consider the way in which you do this and the order. Not only will this affect the type of investments you hold within your portfolio, but it could also affect how you hold your portfolio and provide tax planning opportunities or pitfalls.

Focus on total return
With interest rates at historically low levels, it is difficult to rely solely on income returns in this investment environment. The total return is a truer picture of performance and takes into account the capital appreciation as well as the income received.

Be boring!
To quote Warrant Buffet, one of the world’s most successful investors: “Lethargy, bordering on sloth should remain the cornerstone of an investment style”.

Do not try to chase returns or the trends in investments – stick to tried and tested assets. At Spectrum, we only use investments that have worked over the long term, are easy to understand, daily tradable and transparent.

5 reasons cash might not be king

By Mark Quinn
This article is published on: 16th May 2022

16.05.22

In the words of Warren Buffett, “The one thing I will tell you is the worst investment you can have is cash”.

If one of the world’s most successful investors believes this, let’s look at some of the reasons why holding large amounts of cash is bad for long-term financial planning.

Inflation
We all need access to cash for daily spending and emergencies, so it is important that you hold enough cash on deposit for if the boiler breaks! But holding large amounts of cash over long periods is damaging when the interest rates are well below the rate of inflation.

To illustrate this in real terms, if your annual spending was £10,000 in 2011, you would need £12,968 in 2021 to make the same purchases as inflation averaged 2.6% p.a. However, during that same period, the average savings account interest rate was 1.6% p.a. so the same £10,000 in a bank account would only have grown to £ 10,160.

Low-interest rates

Interest rates offered by banks to customers rarely beat inflation, so using this as a long-term savings strategy is not ideal.

According to the most recent data available provided by the Bank of England and Portugal, the average UK deposit interest rate offered in December 2021 was 0.3% and the average rate in Portugal was 0.06% as at December 2020.

With inflation currently sitting at 5.4% and 3.3% for the UK and Portugal respectively, we can see that inflation will rapidly erode the value of your savings.

Taxation
One of the commonly overlooked factors when making any investment is the tax consequence. In the UK there are great tax-free savings vehicles such as ISAs, but here in Portugal, the choice is much more limited but that does not mean that tax-efficient savings are not available.

For those with NHR, there is not so much of a concern as foreign earned interest is tax-free. However, for normal residents, all interest paid is taxable at 28%. Please note, interest from bank accounts held in blacklisted jurisdictions such as Guernsey, Jersey and the Isle of Man is always taxable at 35%.

Investments usually outperform cash in the long-term
Most people feel more comfortable holding cash, maybe because they do not understand the stock market or they are reluctant to seek financial advice.

It is true, investing in the stock market does carry some risk and you will experience volatility which can be unnerving, but over the long-term markets have outperformed cash.

The Barclays Equity Gilt Study 2019 analysed cash, equity and gilt performance from 1899 to 2019 and it found that £100 invested in cash in 1899 would be worth £20,000 in 2019; a stark contrast to the £2.7m it would worth if invested in equities over the same period.

We might not all live to see returns over 120 years, but even with the global health and economic crisis today, many global stock markets finished the year higher than they started. For example, Morningstar’s Global Markets index was up nearly 15% by mid-Dec 2021, whilst banks were offering returns below 1%.

Dividends
Stocks and shares pay dividends in addition to the expectation that their price will increase. Cash only pays interest, and with inflation, there is a near-certain expectation our cash value will erode in real terms over time.

Lastly, what are the alternatives? Simply put, investing. What you should be investing in and where will be dependent on several factors such as your goals and the risk you can, and are prepared to, take. If you would like to discuss your options, please get in touch.

Real Estate vs. Diversified Portfolio

By Jozef Spiteri
This article is published on: 26th April 2022

26.04.22

Owning property is important to many people and is probably one of the first goals of young adults once they enter the working world. People in their twenties and thirties usually make their first real estate purchase for residential reasons, sometimes renting a room out to generate some extra income. When people enter their mid to late forties, especially in Malta, they tend to start considering purchasing more property, this time as rental investments. This is what I will be looking at more closely in this article.

In the past, the main aim of people entering the latter end of their working lives was to accumulate as much property as possible to be able to live comfortably off the rental income generated. That doesn’t sound like the worst idea in the world, especially if you have the means for it. The more property one has, the more income is coming in and the risk of being caught out with periods of no rental income decreases. A question no one seems to ask though is, “What return am I really making?”

real estate in Malta

This is a question I have been asked quite a few times, and I will make use of a numerical example. Imagine someone has €1,000,000 laying around to invest in property. This could potentially be enough to purchase 4 apartments valued at €250,000. Assuming this investor has these apartments rented out all year round on a long-let basis earning him €1,000 per month each (€4,000 total), the annual return made would be 4.8%. This is assuming there are no months where an apartment is vacant and not taking into consideration maintenance costs and taxation; which means the net return can be substantially lower.

Is there an alternative though? One solution to the real estate approach is building up a portfolio invested in a diversified selection of assets. Such portfolios include property too, but they also allow exposure to many other asset classes which will help increase returns. The advantages of such an approach do not stop at the increased returns. Clients will not have to deal with the headache of maintaining their investment as they will have investment managers doing that for them. Another plus is that investment portfolios are more liquid than real estate and investors can take money when needed, leaving the rest of their funds in the portfolio to continue growing for them.

If you are interested in having a discussion and need some guidance on what your next steps should be, feel free to reach out to us. All our first consultations carry no charge and there is no obligation to proceed further.

Sustainable & Ethical Investment funds in Spain

By Chris Burke
This article is published on: 25th April 2022

25.04.22

More and more people are contacting me regarding sustainable investments in order to understand the choices available, whether they offer a good return on your investment and would you get any more return if you didn’t invest sustainably/ethically? We all know the planet needs our help but we also want to know that our hard-earned monies are working for us – it can be a difficult emotional trade off.

Sustainable & Ethical investing has hit the world by storm over the last few years. By the end of 2019, professionally managed assets using sustainable strategies grew to $17.1 trillion, a 42% increase compared to two years prior, according to the U.S. SIF Foundation (2021). The organization also estimated that $1 out of every $3 under professional management is now invested under ´´sustainable practices´´.

Recent studies have also shown that Sustainable Investment funds, as well as providing ways to invest responsibly, provide both financial performance and lower levels of risk. For this reason, in part, many deem including sustainable investments in their portfolio is a ‘no brainer’.

Let’s say for example that you are in the market to buy a new dishwasher. You’ve analysed several products and have narrowed your choice down to the last two. Both products cost the same amount and wash dishes equally as effectively, yet one of them uses less electricity and is considered safer due to the addition of extra safety features. Which one would you pick?

ESG funds

When comparing the returns of sustainable funds and traditional funds, is there a financial trade off?
A common belief held by investors when comparing mutual funds that are performing to a similar standard is that the one with a sustainable investing model may not perform as well. However, a Morgan Stanley (2019) report has debunked this myth. The report analysed the performance of 10,723 mutual funds from 2004 to 2018 and found that the returns of sustainable funds were in line with comparable traditional funds, stating that ‘there was no consistent and statistically significant difference in total returns’.

When comparing the levels of risk of sustainable funds and traditional funds, is there a trade off?
The Morgan Stanley (2019) report found that sustainable funds experienced a 20% smaller downside deviation than traditional funds, a consistent and statistically significant finding. In years of higher market volatility (such as 2008, 2009, 2015 and 2018), sustainable funds downside deviation was significantly smaller than that of traditional funds. The study took an in-depth dive into in the last quarter of 2018 during which we saw extreme volatility in the US equity markets. Despite negative returns for almost every fund, the median US Equity sustainable fund outperformed the median US Equity traditional fund by 1.39%, and also had a narrower dispersion.

These findings may come as a surprise to many. There is a general consensus amongst investors that by investing in sustainable funds, you will also miss out on financial gains. The research based on concrete evidence of market performance over the past few years suggests that this is not the case, and that there is in fact no financial trade off when investing sustainably. Over the forthcoming years, I believe that the adoption of sustainable investments will continue and that we will continue to see the opportunity gap between investor interest and adoption narrow.

If you would like to speak with an expert on Sustainable and ESG Investments, Chris Burke is able to discuss with you the new investments in this area. Chris is also able to review your current pensions, investments and other assets, with the potential to make them more sustainable moving forward.

If you would like to find out more or to talk through your situation and receive expert, factual advice, don’t hesitate to get in touch with Chris via the form below, or click the button below make a direct virtual appointment.

Sources:
“Sustainable Investing Basics, 2021,” US SIF Foundation: The Forum for Sustainable and Responsible Investment, https://www.ussif.org/sribasics. Accessed March 24, 2022
“Sustainable Reality – Analysing Risk and Return of Sustainable Funds, 2019,” Morgan Stanley, https://www.morganstanley.com/content/dam/msdotcom/ideas/sustainable-investing-offers-financial-performance-lowered-risk/Sustainable_Reality_Analyzing_Risk_and_Returns_of_Sustainable_Funds.pdf. Accessed March 24, 2022

Measuring investment performance

By Mark Quinn
This article is published on: 11th April 2022

11.04.22

There are several different ways of measuring your investment performance, and I will run through some simple tips to allow you to dig deeper into your portfolio.

Firstly, do not forget to factor in fees such as adviser and management fees and structure costs when looking at returns. I have seen the cost of some investments run as high as 4% p.a. through hidden commissions and explicit charges. These have been disguised by strong market performance over recent years, but are likely to be exposed if we experience leaner years in markets in the future.

Simple benchmarking
A simple and quick method of comparison is looking at interest rates on cash accounts. If your investment returns are generating the same returns as cash on deposit, why are you taking the market risk?

Similarly, take into account inflation. If you generate a 3% return and inflation is 2%, your net return is just 1%; is this what you thought you were achieving?

Lastly, look at what similar passive investments have done. These types of funds simply track a stock market index and are inexpensive. If you are paying a fund manager to outperform and add value by trying to achieve higher returns, have they done this?

Measuring investment performance

More in-depth methods

Market indices
A market index tracks the performance of a group of shares or other investments e.g. the S&P 500 index which tracks the performance of the largest 500 shares in America. They can be a useful barometer for the ‘health’ of an investment market as a whole but it is important to use them appropriately.

For example, you cannot meaningfully compare the performance of the S&P 500 index (100% shares) with a portfolio that consists only 40% of shares. Similarly if you are comparing a euro denominated portfolio with the US market which is denominated in dollars, then again this is not necessarily an appropriate comparison.

The downsides of using indices as a comparison are therefore addressed by the use of:

Peer group
A peer group allows you to compare investments that are similar in nature e.g. a specific class of investments or geographical region, and because you are comparing “like for like” it can be a more meaningful comparison tool.

Morningstar.com is a particularly useful tool in this respect and can guide investors with regard to an appropriate benchmark and peer group.

Quartile rankings
These are used to compare returns of investments in the same category over a period of time. Investments in the top 25% are assigned quartile rank 1, the next 25% quartile 2 etc.

They can be useful in tracking consistency – what is important is not the quartile ranking in any one period, but they allow you to track trends over multiple periods and time frames.

There is no one way, or right way, to compare performance and you will likely need to combine several measures to get a more accurate reflection of performance. Even more importantly, this should be done regularly to ensure you are doing all you can to achieve your financial goals. Finally, you should take into account the risk you are taking to achieve a set level of return, and this will be the focus of a future article.

If you would like to discuss your performance or how best to build your own portfolio of investments, please get in touch.

Investing During War Times

By Chris Burke
This article is published on: 7th March 2022

07.03.22

Off the back of the current situation in Ukraine, many of my clients have been asking me what this means for their investment and pension portfolios. Irrespective of the size and scope of the conflict, any declaration of war has global repercussions. Instability in one area of the world will result in a ripple effect, effecting other areas of the world regardless of the countries involved. Yes, this is likely to affect your investments and your pensions but the key takeaway is that you should not worry. If you are panicking, please reach out to me and we can have a conversation about it. There are even areas of opportunity in war times and stocks in certain sectors have even bucked the trend and outperformed. In this article, I will discuss investing in war times, including the current conflict in Ukraine, and the impact that this has on the stock market performance and the wider economy.

The Current Conflict in Ukraine
In the case of the current conflict between Russia and Ukraine, the heavy sanctions inflicted on Russia already have and will continue to heavily effect the global economy. The sanctions are amongst the harshest sanctions ever imposed on a country, and include preventing the Russian Government from accessing up to 600 billion USD in foreign cash reserves which they hold in foreign banks around the world, banning Russia from SWIFT (thus preventing Russians from using various credit and debit cards to make payments) and the freezing of the assets of some Russian individuals around the world ranging from bank accounts, property and even private yachts.

Various multinational companies have also ceased or reduced their operations in Russia (at least temporarily). For example, Apple have closed their Russian stores, Shell and BP have sold their stakes or abandoned their Russian operations and a magnitude of aviation companies such as British Airways, Lufthansa and Boeing have either halted their flights to Russia (note that there have also been significant alterations to the accessibility of international airspace) or in Boeing’s case, suspended parts, maintenance and technical support for Russian airlines.

impact of wars on stockmarkets

The conflict does not solely impact the Russian economy. A large number of countries throughout the world export products to Russia. If this is no longer possible, then they will see a reduction in profits, which will then go on to affect their balance sheet. Furthermore, many countries in the world import products from Russia. The key product in this case is oil, a vital energy source. Although the supply of oil has not yet been cut, we have already seen a rise in petrol prices in many countries such as the UK. Other popular Russian products such as vodka are likely to be hit. Due to the decrease in supply, we are likely to see both shortages and a rise in price of Russian products such as vodka.

However, it is very difficult to predict exactly what will happen. For this reason, when making personal finance related decisions it is recommended that you engage in a professional discussion with a professional financial adviser. In times of war in particular, it is recommended that people seek the advice of an expert to help them manage their portfolios.

Previous Wars and Their Impact on Stock Market Performance
It’s important that we consider previous wars and the impact that they had on the stock market. Some civil wars and internal conflicts, such as those in Sierra Leone (1991-2002) and the Central African Republic in 2013, caused severe disturbances in those countries’ economies. However, from a global perspective, these wars did not cause disturbances in the stock market of first-world nations such as the USA. On the other hand, large-scale wars such as World War 1 and 2 did effect the US market, even before the US entered the conflict.

Global markets in the past operated very differently from how they operate today. For example, prior to World War 1 every country operated independently and the countries that operated in global trade were seen as at ‘gold standard’ level. London was the world’s financial capital and used in this way when a financial centre was necessary, however the requirements and responsibilities were very different when compared to nowadays.

At the close of World War 2, significant changes were made to the global financial system which increased interdependence between countries. The World Bank and the IMF (International Monetary Fund) were created, and from then on stocks reacted very differently from World War 1 and World War 2 when conflicts arose.

It’s also important to consider the popularity of the war on the home front and the amount of time in which the war goes on for. For example, the Vietnam War and the Gulf War both saw very different stock market outcomes in the USA due to the difference in popularity of the wars amongst Americans. Furthermore, the Afghanistan War lasted almost 20 years. In this 20 years, the markets saw both highs and lows. Ultimately, the longer a war goes on the less reactive a market is to its influence. A war may start to be seen as a ‘Business as usual’ type of operation.

I created the below table, summarising previous wars and their impact on the economy and stock market performance (I used the Dow Jones stock market as a comparison).

WAR EFFECT ON ECONOMY
World War 1
  • Nations that imported more than they exported lost gold reserves, negatively impacting their economies, because the slow economic conditions saw greater demand for exports
  • When Archduke Franz Ferdinand was assassinated, what is considered as the start catalyst of the war, the stock market was barely effected
  • When Austria-Hungary declared war on Serbia in 1914, the Dow Jones dropped by 30% and the market had to close to maintain order and stability. When it opened a few months later, it sawed up by 88% and continued to rise until late 1916
  • When the US declared War in Germany in 1917, the stock market took a hit and continued trending downwards into 1918. It didn’t recover fully until mid 1919, on the news that the war was over
World War 2
  • The US was just emerging from the Great Depression in 1939 when the war started. In the early days of the war the Dow Jones increased over 10%, offering hope that the geopolitical environment would put an end to the challenging economic times. However, the conflict started to disrupt international trade and after this initial boost, the market started to fall significantly
  • Rapid action from various impacted Governments around the world prevented the stock market from falling further than it did
  • From 1939 to the end of the war in 1945, the Dow Jones was up 50%. Considering the economic conditions, this was a rather unexpected gain. The gain was put down to the various international cooperation agreements which succeeded in stabilising and growing the US economy
Korean War
  • The Dow Jones dropped around 5% on the first day – the war was a shock to most investors
  • The recovery was fast, and by the time the war ended in 1953 the Dow Jones was up almost 60%. This is thought to be due to a number of Government policies such as increasing taxes and not borrowing money to fund the war.
Vietnam War
  • The Dow Jones grew by 43% from the start to the end of the war (1965 to 1973), despite its low popularity
  • However, it was not all plain sailing. The Government’s decisions on funding the war caused inflation, setting off a mild recession in 1970
Gulf War
  • The Gulf War only lasted for 7 months. Due to its shortness, it is more difficult to separate the changes caused by the conflicts from those related to other world events. For example oil prices increased, causing a brief recession, which is an unusual event for war times
  • When comparing the Gulf War with the previous wars, the US economy has changed a lot. The economy changed from processing natural resources and manufacturing capital goods to primarily knowledge based work (producing information and services). This may have meant that the stock market reacted differently during this war compared to previous wars.
Afghanistan War
  • The Afghanistan War lasted for almost 20 years, making it difficult to measure the impact of the war
  • There were two crashes (2008 Global Financial Crisis and 2020 Covid Pandemic) which were both followed by quick recoveries, however these were largely unrelated to the war
  • Industries such as Real Estate, Data Processing and Information Services and Computer Systems design and related services saw huge growth, suggesting that the war did not influence them. Shares in industry-leading defense contractors also profited significantly during the war.

Do any Patterns Emerge from Historical Stock Market Performance During War Times?
In the early days, there is certainly volatility. For example, both the FTSE and the Dow Jones took a dip last week (25/02/22) when Russia invaded Ukraine, however both have recovered since then. Logic dictates that this volatility continues throughout war times, however history has shown that this is not always the case. Yes, during pre-war times and at the beginning of a war (especially if there is no escalation period and the war breaks out suddenly without warning) stocks prices tend to decline due to shock and uncertainty. However, once war begins, history has shown that the stock market goes up, as has been the case with the Dow Jones and the FTSE this week (as of 03/03/22).

Generally speaking, there is no need to panic. Panic selling stocks and investments at the start of a war could prove to be a very bad move, considering that early sharp drops tend to be followed by steady gains. However, it is also important to note that the world is changing and that historical patterns may not play out again in future conflicts. Economics and the way in which the stock market behaves is very complex and depends on a variety of internal and external factors such as earnings, valuation, inflation, interest rates, and overall economic growth. Regardless of world events, investors should maintain proven strategies to protect and grow portfolios. The best way in which you could do this is to speak with an expert, and have your investment portfolio professionally managed.

If you would like to speak with an expert, Chris Burke is able to review your pensions, investments and other assets, with the potential to make them more effective moving forward. If you would like to find out more or to talk through your situation and receive expert, factual advice, don’t hesitate to get in touch with Chris via the form below:

What is a good investment return?

By Mark Quinn
This article is published on: 11th February 2022

11.02.22

This was a question posed to me by a client recently. I was taken aback by the question as most clients (rightly or wrongly) tend to have fixed expectations about what a ‘good’ and ‘bad’ return is. It was an excellent question and I answered by saying that ‘good’ isn’t absolute; it is relative to the economic and financial environment in which we live.

For example, I remember walking into Cheltenham & Gloucester, Manchester in 1997 and opening a savings account and earning 7.5% per annum! Back then, the Bank of England base rate was 7.25%. If at the same time you were achieving a 7.5% pa return by investing in say, shares or gold, this would not be a ‘good’ rate of return because you would be taking much more risk to achieve the same return as that offered by the bank and only a few basis points above the base rate.

So, with the Bank of England interest rate currently sitting at 0.50% and the ECB base rate at a negative figure of -0.50%, a 4% or 5% pa return looks very attractive today, even though it would not have done in 1997.

Another factor we need to consider when assessing what a ‘good’ return means is the level of risk we take to achieve the return.

In constructing our portfolios at Spectrum, we always consider performance in the context of risk taken to achieve that return. For example, two funds can both achieve a 5% pa return but one fund may have fallen in value by 20% whereas another fund may be down just 5%. Clearly, the latter is a better fund.

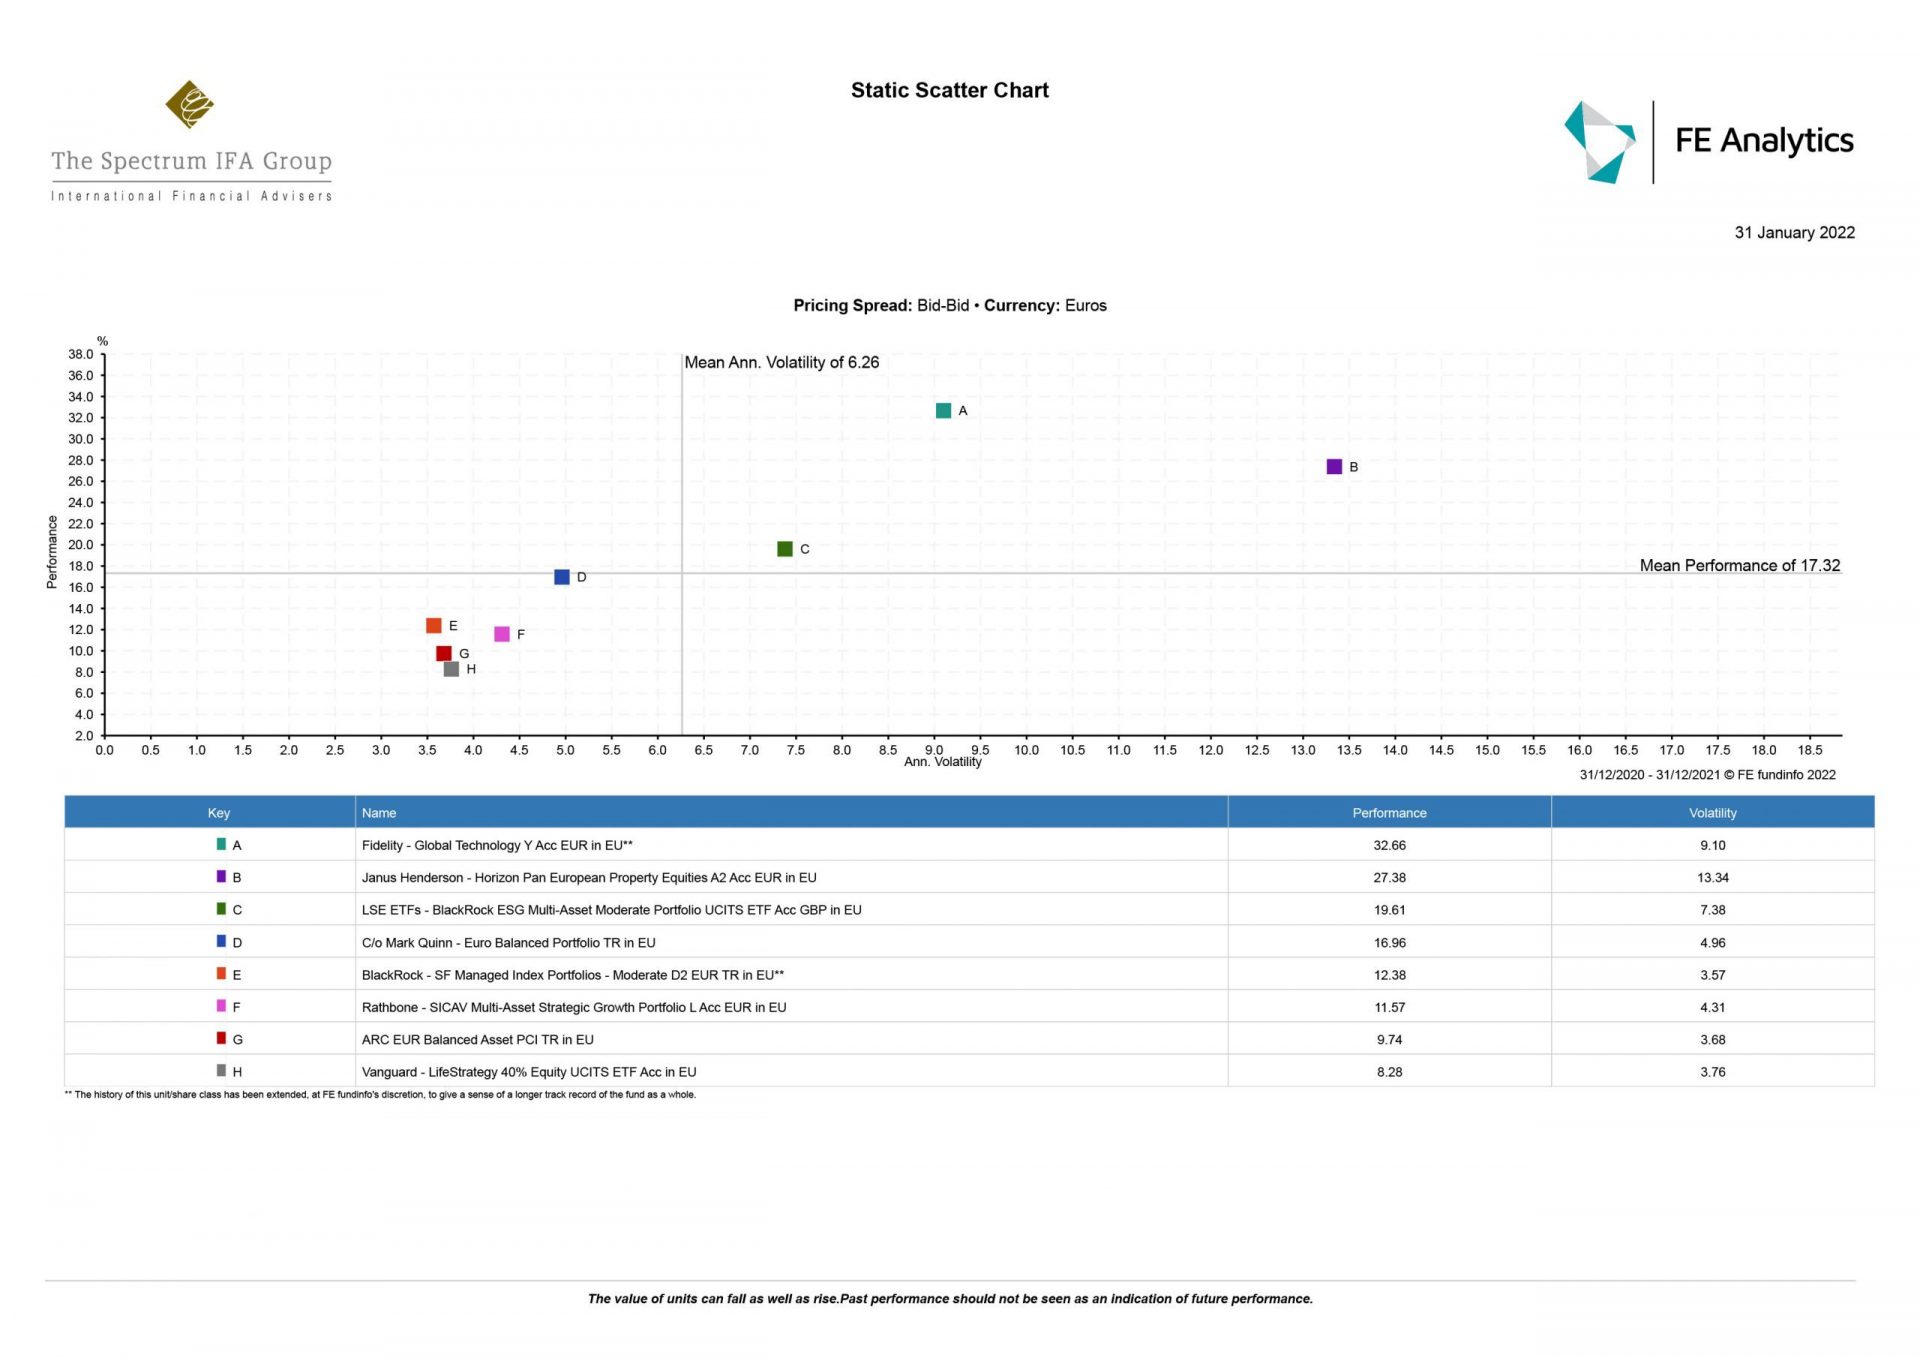
We can analyse this in more detail by considering “scatter diagrams” which is an interesting way of looking beyond headline performance figures.

CLICK ON THE IMAGE ABOVE FOR A LARGER VIEW

This type of chart shows performance on the vertical axis and compares this with volatility on the horizontal axis, which is a measure of risk.

Ideally, we want a fund that is in the top left of the chart i.e. it has very low risk and a very high return. Unfortunately, we know that we cannot have our cake and eat it and in the real world we have to take risk to achieve return, but the important thing that these types of charts highlight is if you are taking risk and not being rewarded for it.

For example in the above chart, fund B (purple square on the far right) is taking a high level of risk relative to the other funds as it is the furthest right on the horizontal axis and it is achieving a high level of performance as it sits high up on the vertical axis. Now, looking at fund A (aqua square second from the right), it has achieved a higher level of performance than fund B but has experienced much less volatility. It is clearly a superior fund, achieving higher performance with less risk.

The other factors we must also take into account when considering what a ‘good’ return means are the cost of running the investment and the impact of taxation.

Ensure you consider all costs when assessing whether you are getting a good return or not. Each fund manager will charge a percentage ongoing fee, but do not forget to factor in transaction costs on buying and selling investments.

Often more damaging is the taxation. Are you paying capital gains tax on each transaction as it occurs? Could you roll this up instead and benefit from compounding? Or are the tax implications impacting the decisions you make as an investor?

For example, a buy-to-let property that offers an attractive gross yield of 6% per annum looks like a good return on the surface, but once ongoing costs and tax are factored in, your net yield could be much lower, at around 2-3%.

Lastly, when comparing investments, you must always do a like-for-like comparison. So when you are benchmarking your investment ensure it is against its peers, for example, there is no point in comparing the gross return of your buy-to-let property against a BP stock you hold.

Investment performance and reliability

By Jozef Spiteri
This article is published on: 20th January 2022

20.01.22

Investment decisions can be confusing; there are just so many options! The most important thing to check is that the assets selected suit your profile and needs, and that the company handling your money is financially sound with a solid reputation. One range of funds we find works consistently well for our clients here at The Spectrum IFA group is from Prudential International. These funds are called PruFunds.

PruFunds start off by spreading investments across different asset classes. The various funds on offer contain assets such as equities, bonds, property, commodities and cash. This balances the performance of the funds as a whole, avoiding the volatility that comes when money is invested in a single asset class. This is known as diversification. All PruFund funds are managed by Prudential’s specialist and highly successful multi-asset portfolio management team. The size of these funds allows Prudential to invest in a wide range of assets globally and across many economic sectors, further adding to the diversification.

investment performance

The second notable and valuable feature of PruFunds is its ‘smoothing’ mechanism. The particular attraction of the smoothing process is that investment profits are held back from market highs to protect your investment from suffering the full lows of market crashes. A steady return is something most investors greatly appreciate.

PruFunds are widely recognised for strong long-term investment performance, reliability of returns and insulation from stock market volatility. This protection from volatility, achieved through the risk-managed smoothing mechanism, is a feature of the funds which is particularly appropriate for investors seeking a balance between capital growth and preservation.

This is just a taste of what PruFund has to offer. If you have further questions, or wish to have a closer look at the various fund options available, feel free to contact us. Our initial meetings are free of charge and entirely without obligation.

Find out more about the PruFund here

Investment options

By Jozef Spiteri
This article is published on: 18th January 2022

18.01.22

Trust in the financial sector

Choosing investments can be daunting to someone who does not have a good understanding of financial matters. It is normal to feel intimidated when facing something you don’t understand, and it is a reaction many people have when considering investing their money.

For these people, the ideal investment is often something they can see and touch. Such investments are usually the purchase of property to let, or the establishment of some sort of business selling goods or services. Done correctly such ventures can be very profitable, but these types of investments require a lot of time and money, so they might not be suitable for most people.

An alternative is investing in financial markets, but how can you overcome the mental block when attempting to allocate your money? The best first step is to consult an adviser who will walk you through the key points of such investments, explaining the potential risks and also rewards of different investment options, and who will take the time to come up with the correct solution for you.

investment decisions

However, the most important step to get more comfortable with financial markets is to actually start investing. An analogy I like to use is of a person who has never been swimming, fearing that something terrible would happen if they were to get into the water. Typically, they would start by dipping their toes and legs in, getting a feel for this un-chartered territory. Once they feel comfortable, they will continue to walk further out, until eventually they will be completely at ease in the water. This is the approach new investors should take when looking to enter this “new world”.

If you are feeling confused or overwhelmed with all the different investment options available to you, feel free to reach out to one of our advisers. In the initial meeting we will be able to help you understand better what will suit you best and can answer all the questions you might have. All initial meetings are free of charge and there is no obligation to proceed with an investment.